The short answer first: centrality quantifies how connected each symptom is within an estimated network. Four metrics dominate the literature — strength, expected influence, closeness, and betweenness — and they are not interchangeable. Strength and expected influence are the workhorses; closeness and betweenness are frequently unstable in psychological data and should rarely carry your interpretation. And no centrality metric, by itself, identifies a “cause” or an “intervention target.”
This is the first post in a short series on reading symptom networks. Last week we looked at why depression and anxiety co-occur from the latent-variable and network perspectives. If the network view treats disorders as systems of interacting symptoms, the natural next question is: which symptoms matter most in the system? Centrality is the standard first answer — and also the most misread one.
What a centrality value actually is
After estimating a network (typically a regularized partial-correlation network via EBICglasso; see Epskamp, Borsboom, & Fried, 2018), each node — each symptom — sits in a web of weighted edges. Centrality collapses that local web into a single number per node.
Strength is the simplest: the sum of the absolute values of all edge weights connected to a node. A symptom with strength 1.2 has, in aggregate, stronger unique associations with the other symptoms than one with strength 0.6. In cross-sectional psychopathology networks, strength is the metric that has held up best under stability checks (Epskamp et al., 2018).
Expected influence (EI) fixes a subtle problem with strength. Because strength uses absolute values, a symptom connected by strong negative edges gets the same credit as one connected by strong positive edges — even though their roles in symptom spread would be opposite. EI sums the signed edge weights instead (Robinaugh, Millner, & McNally, 2016). When your network contains negative edges — common once reverse-scored items or protective factors enter — EI is the better default.
Closeness is the inverse of the average shortest-path distance from a node to all other nodes: how “near” a symptom sits to the rest of the network. Betweenness counts how often a node lies on the shortest paths between other pairs of nodes: how much it acts as a bridge or bottleneck.
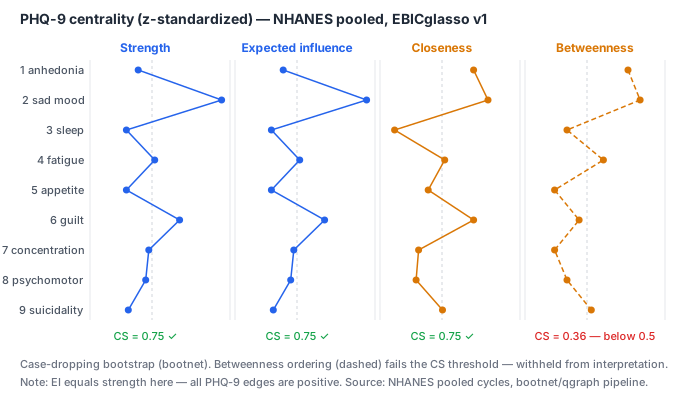 Real estimates from our public NHANES pipeline: strength, EI, and closeness clear the CS threshold (0.75); betweenness does not (0.36) and its ordering is withheld.
Why two of the four deserve skepticism
Closeness and betweenness were imported from social network analysis, where paths mean something concrete: information, disease, or resources literally travel along ties between people. In a partial-correlation network of symptoms, it is far less clear that a “shortest path” corresponds to any real process (Bringmann et al., 2019). On top of the conceptual issue, there is an empirical one: in typical psychological datasets, closeness and betweenness estimates are unstable. Case-dropping bootstrap analyses routinely show their rank ordering collapsing well before strength does — quantified by the correlation-stability (CS) coefficient, with 0.25 as a minimum and 0.5 as a preferred threshold (Epskamp et al., 2018). If your CS coefficient for betweenness is 0.13, the honest conclusion is that you cannot interpret the betweenness ordering at all.
Practical reading rule: report all four if you like, but interpret strength or EI, and only after checking stability with bootnet.
The interpretation trap: central ≠ causal
The tempting leap is: “the most central symptom is the best intervention target.” Resist it, for two reasons.
First, centrality is computed on undirected, cross-sectional associations. A symptom can be highly central because it drives other symptoms, because it is driven by them, because it shares measurement overlap with them, or because an unmodeled variable connects them. The statistic cannot distinguish these.
Second, there is a level-of-analysis problem. Most published symptom networks are between-person structures: they describe how symptoms covary across individuals. The network operating within one person over time need not have the same structure — and in general it will not, unless strong stationarity and homogeneity assumptions hold (Bringmann et al., 2019). A centrality ordering estimated from 30,000 respondents is a property of the sample, not a map of any single client’s dynamics.
None of this makes centrality useless. It makes centrality what it is: a descriptive summary of a symptom’s connectedness in an estimated structure — a starting point for hypotheses, not a verdict.
Reading a centrality plot in 30 seconds
When you meet a centrality figure in a paper (usually z-standardized values from qgraph::centralityPlot), a quick protocol:
- Find the stability evidence first. Look for bootnet case-dropping results and CS coefficients. No stability analysis → treat the ordering as provisional.
- Read strength/EI, glance at the rest. If closeness or betweenness tells a dramatically different story, that is usually a reason for caution, not excitement.
- Check for negative edges. If present and only strength is reported, ask whether EI would reorder the top nodes.
- Note the sample and design. Cross-sectional, between-person data supports between-person description — nothing stronger.
What’s next
Centrality describes single nodes. The next post in this series steps back to the estimation itself: why network psychometrics settled on partial correlations and regularization — what EBICglasso is actually doing, and what it trades away.
Sources
- Epskamp, S., Borsboom, D., & Fried, E. I. (2018). Estimating psychological networks and their accuracy: A tutorial paper. Behavior Research Methods, 50(1), 195–212.
- Robinaugh, D. J., Millner, A. J., & McNally, R. J. (2016). Identifying highly influential nodes in the complicated grief network. Journal of Abnormal Psychology, 125(6), 747–757.
- Bringmann, L. F., Elmer, T., Epskamp, S., Krause, R. W., Schoch, D., Wichers, M., Snippe, E., & Fried, E. I. (2019). What do centrality measures measure in psychological networks? Journal of Abnormal Psychology, 128(8), 892–903.
- Opsahl, T., Agneessens, F., & Skvoretz, J. (2010). Node centrality in weighted networks: Generalizing degree and shortest paths. Social Networks, 32(3), 245–251.
This post describes network structures; it is not diagnostic guidance or treatment recommendation.