Series 12/13 · Book preview → Series hub
Over the past eleven weeks this series has covered why depression and anxiety travel together, what centrality does and does not mean, why EBICglasso works with partial correlations, how far a network can be trusted, where the idea came from, what changes when the network belongs to one person, how it meets case formulation, and what a third dimension does and does not add.
A reasonable question at this point is a practical one: if I wanted to start using this, where would I begin?
This post is that answer. It is written for clinicians and counsellors rather than methodologists, and it is deliberately short. The field already has excellent tutorials and a definitive book. What a newcomer usually lacks is not material but an order to read it in — and a clear sense of which questions the software can and cannot answer.
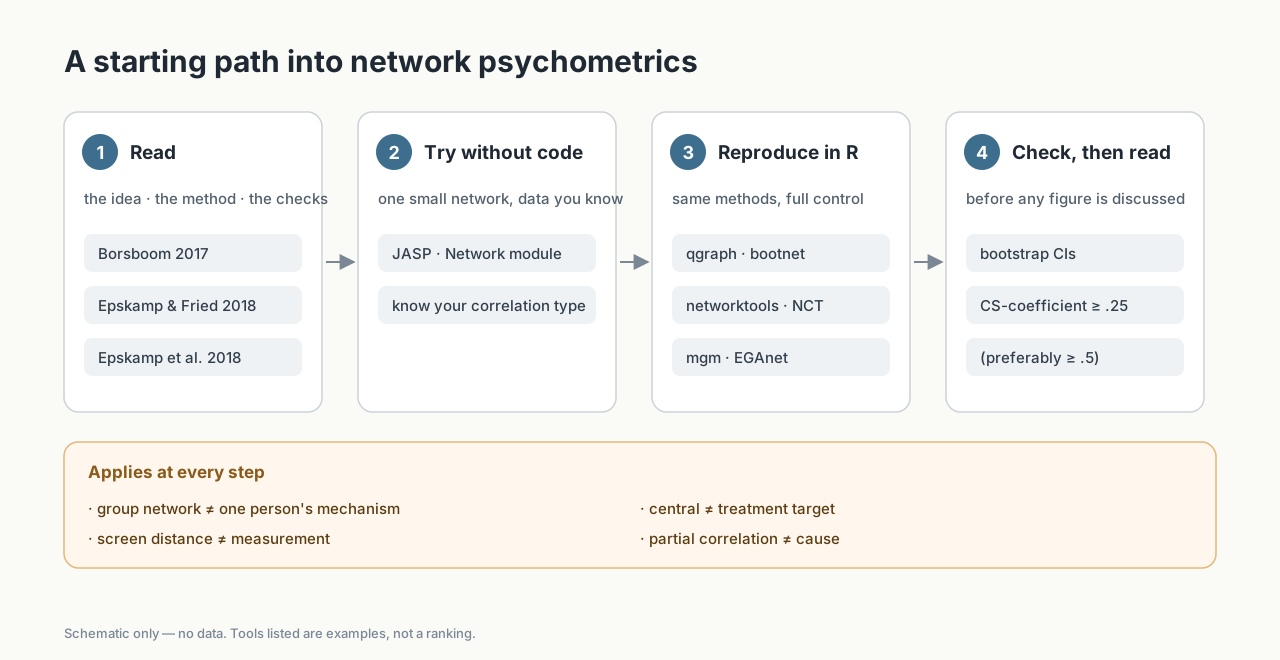
A starting path. Each step has more than one good entry point; the guardrail row applies to every step.
Step 1 — Read three things first
You do not need a reading list of forty papers. Three will carry you a long way.
The idea. Borsboom (2017), A network theory of mental disorders, in World Psychiatry. Short, clear and written for clinicians. If you want the longer argument, Borsboom and Cramer (2013) in the Annual Review of Clinical Psychology is the classic.
The method. Epskamp and Fried (2018), A tutorial on regularized partial correlation networks, in Psychological Methods. This is the paper behind most cross-sectional symptom networks you will meet, including the EBICglasso approach discussed in Week 3.
The checks. Epskamp, Borsboom and Fried (2018), Estimating psychological networks and their accuracy, in Behavior Research Methods. This is where bootstrapped confidence intervals and the CS-coefficient come from (Week 4). Read it before you believe any network, including your own.
When you want to go further, Network Psychometrics with R (Isvoranu, Epskamp, Waldorp & Borsboom, 2022) is the field’s definitive textbook. And when you start reading empirical papers critically, the reporting standards proposed by Burger and colleagues (2023) are a useful lens: they tell you what a well-reported network study should let you see.
Step 2 — Try it without writing code
If you have never used R, start with JASP, the free, open-source statistics package. Its Network module wraps the same estimation machinery researchers use in R — including EBICglasso and bootstrapping — behind a point-and-click interface.
This step matters more than it looks. Estimating one small network yourself, on a dataset you understand, changes how you read published figures. You see how much the picture depends on the sample, how the edges thin out under regularisation, and how unstable centrality orderings can be in small samples.
A practical warning: most clinical questionnaires are ordinal (0–3, 1–5), not continuous. How the software computes correlations for ordinal items — Pearson, polychoric or rank-based — changes the result. Know which one you used.
Step 3 — Reproduce it in R
When you want full control, the core of the ecosystem is a handful of R packages, most of them from the same research groups that developed the methods:
- qgraph — drawing networks, and home of the
EBICglassofunction (Epskamp et al., 2012). - bootnet — a single interface for estimating networks and running the accuracy and stability checks from Step 1.
- networktools — bridge centrality, for symptoms that sit between clusters such as depression and anxiety (Jones, Ma & McNally, 2021).
- NetworkComparisonTest — whether two groups’ networks differ, rather than assuming they do because the pictures look different (van Borkulo et al., 2023).
- mgm — mixed graphical models, when your variables are not all of one type (Haslbeck & Waldorp, 2020).
- EGAnet — exploratory graph analysis, for asking how many dimensions a set of items has (Golino & Epskamp, 2017).
If your interest is a single person measured many times rather than many people measured once — the idiographic approach from Week 9 — the relevant tools (such as graphicalVAR and mlVAR) belong to a different design altogether. That is a later step, not a first one.
Step 4 — Check before you interpret
Every tool above will happily produce a figure. None of them will tell you what the figure is allowed to mean. That part is yours, and it is where most misreadings happen. Before interpreting any symptom network — published, self-estimated, or on a screen in front of a client — run through five questions:
- Is it stable? Look for bootstrapped intervals and a CS-coefficient. Epskamp and colleagues suggest that a CS-coefficient below .25 is too low to interpret centrality, and that it should preferably be above .5.
- Whose structure is this? A network estimated across many people describes that group. It is not, by itself, a map of the mechanism inside any one person (Week 9).
- Is “central” being read as “target”? Centrality summarises the estimated connections. It does not establish which symptom to treat first (Bringmann et al., 2019; Week 2).
- Is distance being read as a measurement? Where a node sits on the page or screen is a by-product of the layout algorithm, in 2D and in 3D alike (Week 11).
- Is a partial correlation being read as a cause? An edge says two symptoms remain associated once the others are taken into account. It does not say which drives which.
If a figure survives these five questions, it is worth talking about. If it does not, it is still worth looking at — just more modestly.
Where PsyNexa fits
Not every clinician will run R, and not every question needs a fresh estimate. That gap is what I have been building PsyNexa around: a network psychometrics platform that presents reference networks estimated from public data, alongside a person’s own scores and how they change across sessions — basic information that clinicians and counsellors can draw on for case formulation and psychoeducation. Self-check scores stay in the browser, and the interpretation stays with the person reading.
It does not replace Steps 1–4. If anything, it assumes them. PsyNexa opens on 1 February 2027 with a free beta period; which features are available in which countries will depend on our legal review.
Start small
The best first project is a modest one: one paper read closely, one small dataset you understand, one stability plot you can explain to a colleague. Network psychometrics rewards patience more than it rewards software. The tools are free; the discipline is the part you bring.
References
- Borsboom, D. (2017). A network theory of mental disorders. World Psychiatry, 16(1), 5–13.
- Borsboom, D., & Cramer, A. O. J. (2013). Network analysis: An integrative approach to the structure of psychopathology. Annual Review of Clinical Psychology, 9, 91–121.
- Bringmann, L. F., Elmer, T., Epskamp, S., Krause, R. W., Schoch, D., Wichers, M., Wigman, J. T. W., & Snippe, E. (2019). What do centrality measures measure in psychological networks? Journal of Abnormal Psychology, 128(8), 892–903.
- Burger, J., Isvoranu, A.-M., Lunansky, G., Haslbeck, J. M. B., Epskamp, S., Hoekstra, R. H. A., Fried, E. I., Borsboom, D., & Blanken, T. F. (2023). Reporting standards for psychological network analyses in cross-sectional data. Psychological Methods, 28(4), 806–824.
- Epskamp, S., Borsboom, D., & Fried, E. I. (2018). Estimating psychological networks and their accuracy: A tutorial paper. Behavior Research Methods, 50(1), 195–212.
- Epskamp, S., Cramer, A. O. J., Waldorp, L. J., Schmittmann, V. D., & Borsboom, D. (2012). qgraph: Network visualizations of relationships in psychometric data. Journal of Statistical Software, 48(4), 1–18.
- Epskamp, S., & Fried, E. I. (2018). A tutorial on regularized partial correlation networks. Psychological Methods, 23(4), 617–634.
- Golino, H. F., & Epskamp, S. (2017). Exploratory graph analysis: A new approach for estimating the number of dimensions in psychological research. PLoS ONE, 12(6), e0174035.
- Haslbeck, J. M. B., & Waldorp, L. J. (2020). mgm: Estimating time-varying mixed graphical models in high-dimensional data. Journal of Statistical Software, 93(8), 1–46.
- Isvoranu, A.-M., Epskamp, S., Waldorp, L. J., & Borsboom, D. (Eds.). (2022). Network psychometrics with R: A guide for behavioral and social scientists. Routledge.
- Jones, P. J., Ma, R., & McNally, R. J. (2021). Bridge centrality: A network approach to understanding comorbidity. Multivariate Behavioral Research, 56(2), 353–367.
- van Borkulo, C. D., van Bork, R., Boschloo, L., Kossakowski, J. J., Tio, P., Schoevers, R. A., Borsboom, D., & Waldorp, L. J. (2023). Comparing network structures on three aspects: A permutation test. Psychological Methods, 28(6), 1273–1285.