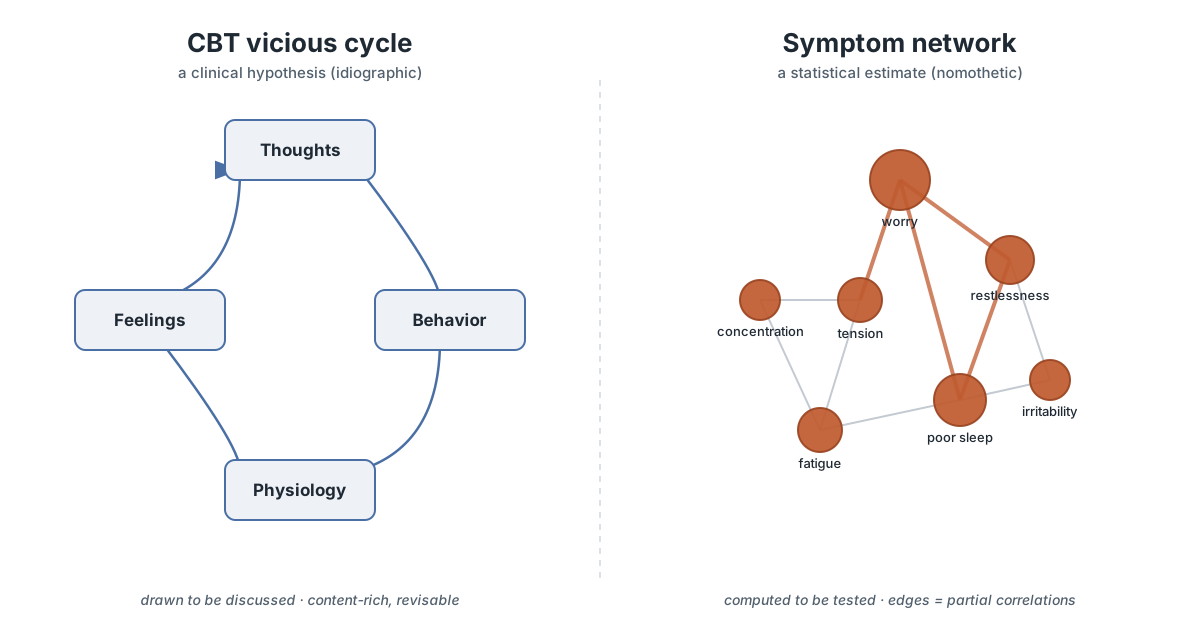
If you have ever done cognitive behavioral therapy, from either chair, you have seen the diagram. A box for thoughts, a box for feelings, a box for behavior, sometimes a fourth for physiology — and arrows running between them in a loop. A worried thought tightens the chest; the tight chest confirms that something is wrong; the confirmation feeds the next worried thought. The vicious cycle.
Now look at a symptom network estimated from questionnaire data — nodes for individual symptoms, edges for the associations that survive after everything else is partialled out. Worry connects to restlessness; restlessness connects to poor sleep; poor sleep loops back toward worry. It is hard not to feel a jolt of recognition. We have been drawing this for years.
So: are the two the same idea? The honest answer is cousins, not twins — and the difference is worth sitting with, because it is exactly the kind of place where an appealing resemblance can quietly mislead.
Where the resemblance is real
The resemblance is not an illusion, and it would be false modesty to pretend otherwise. Both pictures share three commitments that set them apart from the older “underlying disease” story.
First, both take feedback seriously. Neither treats a symptom as a passive readout of some hidden cause sitting behind it. In the CBT loop and in the network alike, elements act on each other. The arrow that goes out comes back around.
Second, both are componential. They care about the parts and the wiring between them, not only about a single summary score. A CBT formulation that just said “the patient has high depression” would be useless; what makes it work is naming this thought feeding that avoidance. A network makes the same move formal — it is, in a sense, a componential formulation with the couplings estimated rather than sketched.
Third, both are, at heart, about a process unfolding in a person over time. The loop is something that spins. The network, at least in its idiographic form, is a claim about how one person’s symptoms push on one another across days and weeks.
That is a genuine three-way overlap, and it is why the network framework has felt intuitive to so many clinicians rather than alien. This is a case of rediscovery: the network formalism recovers something practitioners already knew in their hands. Recognizing that is not a threat to either tradition.
Where they part company
But rediscovery is not identity, and here the useful distinctions begin.
The CBT loop is a clinical hypothesis; the network is an estimate. The four-box diagram on the whiteboard is a formulation — a therapist’s structured guess about how this person works, built from the interview, refined in collaboration, and held loosely enough to revise. A symptom network estimated with EBICglasso is a statistical object — it comes with a covariance structure, a regularization penalty, and, if it was done carefully, bootstrapped confidence intervals telling you how much of it you should trust. One is drawn to be discussed. The other is computed to be tested. Confusing the two — treating a hand-drawn loop as if it had the evidential status of an estimated graph, or treating an estimated graph as if it were a finished clinical formulation — is where trouble starts.
The loop is content-rich; the network is content-thin. The whiteboard arrow says why: “when he thinks I’ll embarrass myself, he cancels the plan, and the relief teaches him to cancel again.” That is a mechanism, with meaning inside it. A network edge says only that two symptoms are associated once the others are held constant. It is deliberately mute about the story. This thinness is a feature, not a bug — it is what lets the network be estimated from data without the researcher’s theory smuggled in — but it means the graph does not hand you the clinical narrative. You still have to supply that.
Levels differ. Most published networks are nomothetic — estimated across many people, describing an average architecture. The CBT loop is stubbornly idiographic — it is about the one person in the room. These are not interchangeable. A structure that holds on average need not hold for any particular individual, a point network psychometrics itself has been vocal about. When a between-person network and a within-person loop appear to agree, that agreement is a finding to check, not a fact to assume.
The tension worth keeping
Here it helps to resist the tidy conclusion. It would be comfortable to say the network is simply “CBT made rigorous,” the loop finally given its equations. But that flattens something.
The CBT formulation and the network estimate belong to different intellectual traditions that pull in different directions — and keeping both in view is more useful than collapsing them. The clinical formulation prizes meaning, singularity, and revisability; it is content to be a working hypothesis about one life. The network prizes estimation, generality, and falsifiability; it wants to be checked against data. The first asks what does this mean for this person? The second asks what structure does the data support? Neither question dissolves into the other. A clinician who treats the estimated graph as the formulation loses the meaning; a researcher who treats the formulation as an estimate loses the rigor.
The resemblance between them is real — but it is a translation across traditions, not a merger of them. And translation is always incomplete. The loop has things the graph cannot hold (the specific belief, the relief that reinforces the avoidance), and the graph has things the loop cannot claim (a confidence interval, a stability coefficient, a structure that generalizes). Reading one as the other, in either direction, quietly drops whatever does not survive the crossing.
What this buys the working clinician
None of this is abstract housekeeping. It changes how you should read a network if you have spent years drawing loops.
Use the network the way you would use a colleague’s second opinion on your formulation: informative, worth taking seriously, and not the last word. If an estimated network puts an edge where your loop has an arrow, that is corroboration worth noting. If it puts a strong edge where your formulation has nothing, that is a prompt to look again — maybe at the person, maybe at the model. If a symptom sits at high centrality, that is a description of its position in the estimated structure — a place worth attending to. It is not, on its own, a verdict that intervening there will move the rest. The step from “central in this graph” to “treat this first” runs through clinical judgment and through causal assumptions the graph does not certify, and it should be walked deliberately, not skipped.
Held that way, the two pictures do not compete. The loop supplies the meaning; the network supplies the discipline of estimation. You lose nothing by keeping both, and you lose something real the moment you decide they are the same thing.
This post is part of a series on the lineage and methods of network psychometrics. The network view does not replace clinical formulation, and nothing here is diagnostic guidance.
Further reading: Borsboom & Cramer (2013); Borsboom (2017), World Psychiatry; Epskamp, Borsboom & Fried (2018), Behavior Research Methods.