The latent variable paradigm did not win because psychologists were careless about causes running between symptoms. It won because it solved the problem psychology actually had — measurement error — and because the machinery it introduced kept scaling: from one correction formula in 1904, to factor analysis, to structural equation modelling, to item response theory. What it set aside was a residue: whatever association remains between two items once the common cause has been partialled out.
Network psychometrics is, at bottom, the decision to treat that residue as the phenomenon rather than as nuisance. But there is a further fact that both camps’ popularisers tend to skip, and it is the one worth carrying out of this post: for important classes of models, the two accounts are statistically equivalent. Fit alone will not choose for you.
1904: the problem was error, not causality
Spearman’s 1904 paper is remembered for g, but its working core is the correction for attenuation — a formula for what the correlation between two variables would have been had they been measured without error. That is the invention. The two-factor account of ability (a general factor plus test-specific factors) followed from it as an interpretation of what was left once error was accounted for.
Read in context, the latent variable was not introduced as a metaphysical claim about what intelligence or depression is. It was introduced as a device for separating signal from noise in badly behaved data, at a moment when psychology’s central embarrassment was that its measurements did not replicate. Judged against that problem, the device worked.
Why it kept winning
Three advantages compounded over the next seventy years.
Machinery. Thurstone’s multiple factor analysis, with rotation and simple structure, generalised Spearman’s single general factor into a workable multivariate method. Lord and Novick (1968) consolidated classical test theory and carried Birnbaum’s item response models into the mainstream, alongside Rasch’s independent line of work. Jöreskog’s confirmatory factor analysis (1969) turned a factor model into something you could specify in advance and reject. Each step made the previous step more useful.
A theory of validity. Cronbach and Meehl (1955) gave the paradigm an account of what it means for a test to measure a construct at all: the construct is located in a nomological network of lawlike relations, and validation is the business of testing that network. Note the word — and note that its referent is different from ours. Their network is a network of constructs and laws, not of symptoms. It is a coincidence of vocabulary, not an anticipation, and it is worth resisting the temptation to read it as one.
Institutional fit. Operationalised diagnostic criteria with count thresholds, standardised scales, and the sum score all sit comfortably inside a reflective model: an underlying severity generates the item responses, so the items are interchangeable indicators, so adding them up is licensed, so coefficient alpha means something, so an item with a low loading may be dropped. The paradigm did not merely offer an interpretation of data. It offered a procedure for building a test, one that could be taught to a graduate student in a semester.
A framework that hands you a procedure will beat one that hands you an interpretation, and it should not be surprising that it did.
What the paradigm requires
Two commitments, stated plainly rather than as an accusation.
Local independence. Items are conditionally independent given the latent variable. Any association left between two items after the latent variable is accounted for is a nuisance to be absorbed — a method effect, item-content overlap, a residual covariance freed to improve fit.
Reflective direction. The latent variable causes the responses; the responses are its indicators. Bollen and Lennox (1991) made the contrast with formative measurement explicit, and the difference is not cosmetic. Under the reflective reading, insomnia and fatigue correlate because both are downstream of depression — not because sleeplessness at night produces exhaustion the next day.
Neither commitment is obviously false. Both are choices. Borsboom, Mellenbergh and van Heerden (2003) pressed exactly this point: the status of a latent variable is a theoretical claim about what a construct is, not a statistical convenience that can be settled by convention.
The residue
Three things kept accumulating outside the model.
Comorbidity. Depression and anxiety co-occur often enough that co-occurrence is closer to the rule than the exception. A latent account handles this with a correlation between two latent variables, or a higher-order factor above them — which relabels the finding rather than explaining it. Cramer and colleagues (2010) proposed reading the overlap as direct connections between symptoms belonging to both syndromes, which is where the notion of a bridge symptom comes from.
Clinical language. Practitioners describe sequences: sleep collapses, concentration goes, work goes, guilt arrives. That is causal talk among symptoms at the same level, which the reflective model does not license as a description of the same objects it is modelling.
Sum-score equivalence. Two people scoring 14 on the PHQ-9 may share almost no items. Under the reflective reading they have the same severity. Under the network reading the configuration is the object, and the two are not the same case.
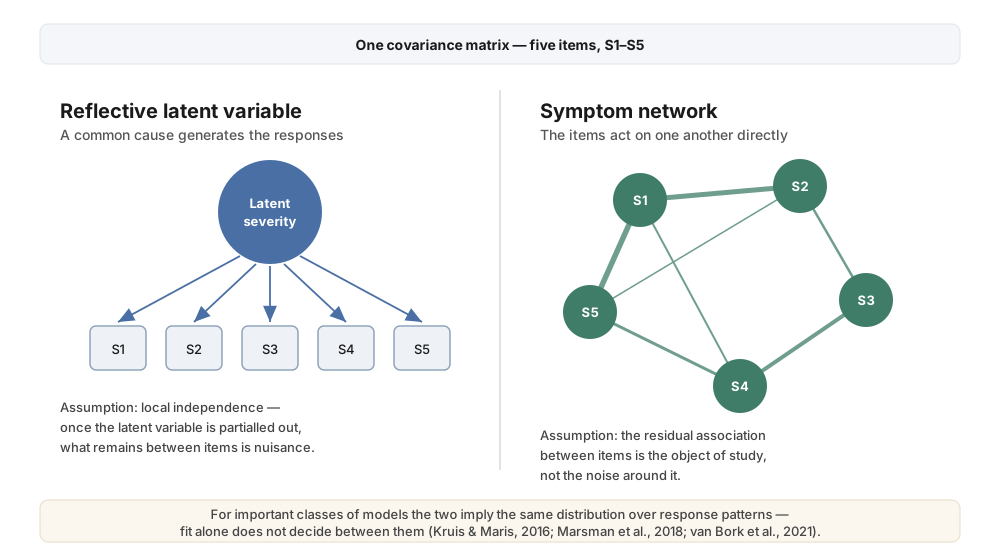
Figure 1. The same five items, told two ways. The disagreement is about where the interesting variance lives — inside the common cause, or between the items.
The part that usually gets skipped
Here the story ought to become uncomfortable for both sides.
For important classes of models, the latent variable and network accounts imply the same distribution over response patterns. Kruis and Maris (2016) showed the correspondence between representations of the Ising model; Marsman and colleagues (2018) worked out the explicit relation between Ising network models and item response theory. Van Bork and colleagues (2021) then examined when latent variable and network models are, and are not, statistically distinguishable — and the honest summary is that in many realistic settings, model fit will not settle it.
So “the network approach won the argument” is not a claim the data supports. What the data supports is weaker and more interesting: the two frameworks answer different questions about the same covariance matrix, and they license different next moves. That is a reason to hold both in view, not to declare one obsolete.
What the network view inherits
Translation runs both ways, and it is incomplete in both directions. The network approach carries its own unpaid debts, three of which are worth naming here.
Most estimated networks are estimated on between-person data. They describe covariation across people, not the dynamics inside one person — the point Molenaar (2004) raised as an ergodicity problem, and which Fisher and colleagues (2018) demonstrated empirically. A group-level network is not a portrait of anyone in it.
Edges are partial correlations, not causal arrows. That is a feature of how they are estimated, and we walked through why in the EBICglasso post.
And sampling variability is severe enough that an unstable network will happily produce a confident-looking picture. This is why edge-weight bootstraps and the case-dropping CS-coefficient exist rather than being optional extras. Fried and Cramer (2017) catalogue these limits from inside the field, which is the right place for the catalogue to come from.
Where this leaves us
The reason to tell this history carefully is not to award a verdict. The latent variable paradigm won a real argument on real grounds, and it continues to do work that the network view does not attempt. The network view asks a different question of the same data, and it inherits a fresh set of problems for doing so.
Our position on this blog has been consistent: translator, not integrator. We put the two traditions side by side and try to state each one in language the other can hear. The interesting work is at the seam, and pretending the seam has closed helps nobody.
References
- Bollen, K., & Lennox, R. (1991). Conventional wisdom on measurement: A structural equation perspective. Psychological Bulletin, 110(2), 305–314.
- Borsboom, D., Mellenbergh, G. J., & van Heerden, J. (2003). The theoretical status of latent variables. Psychological Review, 110(2), 203–219.
- Cramer, A. O. J., Waldorp, L. J., van der Maas, H. L. J., & Borsboom, D. (2010). Comorbidity: A network perspective. Behavioral and Brain Sciences, 33(2–3), 137–150.
- Cronbach, L. J., & Meehl, P. E. (1955). Construct validity in psychological tests. Psychological Bulletin, 52(4), 281–302.
- Fisher, A. J., Medaglia, J. D., & Jeronimus, B. F. (2018). Lack of group-to-individual generalizability is a threat to human subjects research. PNAS, 115(27), E6106–E6115.
- Fried, E. I., & Cramer, A. O. J. (2017). Moving forward: Challenges and directions for psychopathological network theory and methodology. Perspectives on Psychological Science, 12(6), 999–1020.
- Jöreskog, K. G. (1969). A general approach to confirmatory maximum likelihood factor analysis. Psychometrika, 34(2), 183–202.
- Kruis, J., & Maris, G. (2016). Three representations of the Ising model. Scientific Reports, 6, 34175.
- Lord, F. M., & Novick, M. R. (1968). Statistical Theories of Mental Test Scores. Addison-Wesley.
- Marsman, M., Borsboom, D., Kruis, J., Epskamp, S., van Bork, R., Waldorp, L. J., van der Maas, H. L. J., & Maris, G. (2018). An introduction to network psychometrics: Relating Ising network models to item response theory. Multivariate Behavioral Research, 53(1), 15–35.
- Molenaar, P. C. M. (2004). A manifesto on psychology as idiographic science. Measurement, 2(4), 201–218.
- Spearman, C. (1904). “General intelligence,” objectively determined and measured. American Journal of Psychology, 15(2), 201–292.
- van Bork, R., Rhemtulla, M., Waldorp, L. J., Kruis, J., Rezvanifar, S., & Borsboom, D. (2021). Latent variable models and networks: Statistical equivalence and testability. Multivariate Behavioral Research, 56(2), 175–198.